Radim Podola: Library for Profiling and Visualization of Memory Consumption of C/C++ Programs
| Thesis Detail | Institution site |
| Thesis Download | Thesis Download |
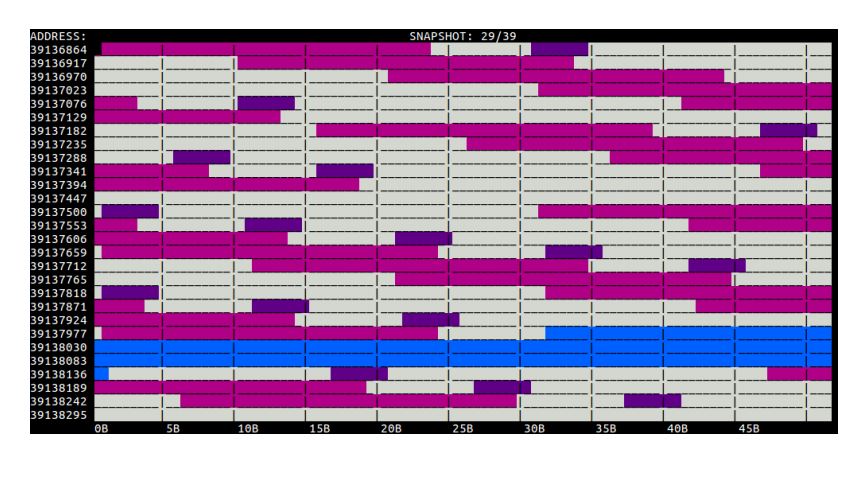
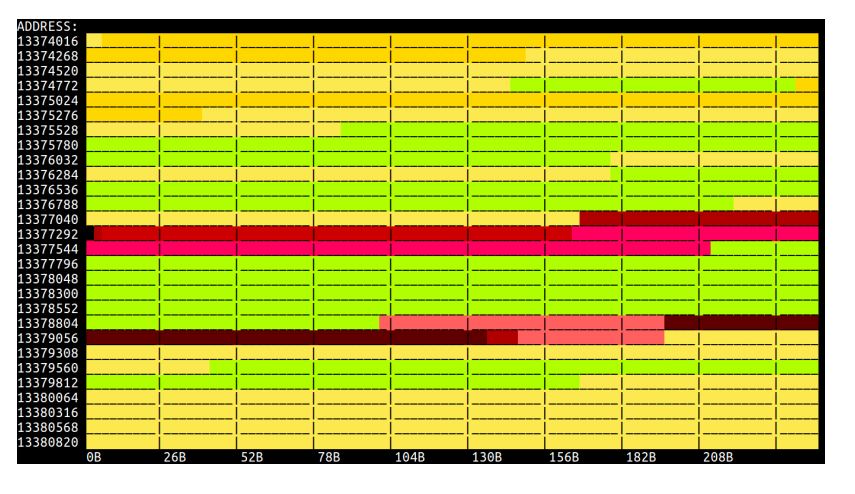
The goal of this thesis was to create a memory profiler of C/C++. The results were interpretered using several kinds of visualizations: (1) heat maps (both in GUI and in CLI using ncurses library), and (2) flamegraphs.
Abstract
Performance is an important and, for some classes of programs, even critical aspect of user experience. The current approaches to performance profiling are, however, far from being satisfactory. The aim of this bachelor’s thesis is to extend the current state-of-the-art of profiling and visualization solutions, with novel techniques which can be used for a more efficient search of performance bugs in C/C++ programs and their subsequent interpretation to the end user. Thesis briefly introduces existing tools dealing with similar problems and then proposes a novel solution to collection of profiling data and their illustrative interpretation. The resulting implementation is, moreover, integrated in the Perun — Performance Control System — platform for profile versioning. The functionality of the implementation is demonstrated on a series of non-trivial programs.